Version 1.0
PAGE 9
Spectral types in the atlas
________________________________________________________
________________________________________________________
_______________________________________________________.
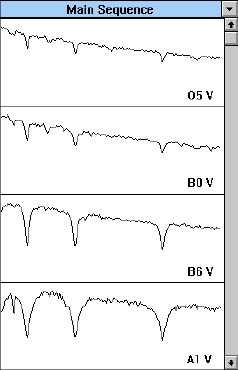
5. Because the spectral types represent a sequence of stars of
different surface temperatures two things are notable: (1) The
different spectral types show different absorption lines, and (2)
The overall shape of the continuum changes. The absorption lines
are determined by the presence or absence of particular ions at
different temperatures. The shape of the continuum is determined
by the blackbody radiation laws. One of these laws, Wein’s Law,
states that the wavelength of maximum intensity is shorter when
the temperature of the object is hotter. This is described math-
ematically in the equation below:
where l
max = the wavelength of maximum intensity in Angstroms
(Å)
T = temperature in degrees Kelvin (°K).
a. As you look through the stars in the Atlas, can you tell from the continuum which spectral type is hottest?
Identify the hottest spectral type? ________________________.
Explain your answer. (Remember that, on all these graphs, 3900 Å is at the left, and 4500 Å is at the right).
_____________________________________________
b. At about what spectral type is the peak continuum intensity at 4200 Å ? (4200 Å is about the middle along
the x axis).
_______________________________________________
c. What would be the temperature of this star?
________________________________________________.
6. Now use the comparison spectra to classify the star. If you look at the panels behind the Atlas window, you will
see that two of the comparison star spectra have already been placed in the two panels above and below the
spectrum of your unknown star. You can see the three panels more clearly by reducing the Atlas window to an
icon (click on the little arrow button at the upper right of the Atlas window to iconize it; if you want the Atlas
window back, you can double click on the icon again.) You should see the spectrum of an O5 star is in the top
panel, and the spectrum of the next star in the atlas, a B0, in the bottom panel.
If neither of these looks quite like a match to your unknown star, you can move through the Atlas by clicking on
the button labeled down to the upper right of the spectrum display. Continue this until you get a pretty good
match. You should find that the best match is with spectral types that have very strong hydrogen lines (more about
how to identify these later), and not many other features. The stars with the strongest hydrogen lines are around
spectral type A1.
Figure 3
The Spectral Window
lmax
7
2
9
10
T
=
. x