Version 1.0
PAGE 5
The spectral type of a star allows the astronomer to
know not only the temperature of the star, but also its
luminosity (expressed often as the absolute magnitude
of the star) and its color. These properties, in turn, can
help in determining the distance, mass, and many other
physical quantities associated with the star, its surround-
ing environment, and its past history. Thus a knowledge
of spectral classification is fundamental to understand-
ing how we put together a description of the nature and
evolution of the stars.
Looked at on an even broader scale, the classification of
stellar spectra is important, as is any classification
system, because it enables us to reduce a large sample
of diverse individuals to a manageable number of
natural groups with similar characteristics. Thus
spectral classification is, in many ways, as fundamental
to astronomy as is the Linnean system of classifying
plants and animals by genus and species. Since the
group members presumably have similar physical
characteristics, we can study them as groups, not isolated individuals. By the same token, unusual individuals may
readily be identified because of their obvious differences from the natural groups. These peculiar objects then be
subjected to intensive study in order to attempt to understand the reason for their unusual nature. These exceptions to the
rule often help us to understand broad features of the natural groups. They may even provide evolutionary links between
the groups.
The appendices to this manual on pages 22, 23, 24 give the basic characteristics of the spectral types and luminosity
classes in the MK system. But the best way to learn about spectral classification is to do it, which is what this exercise is
about.
Introduction To The Exercise
The computer program you will use consists of two parts. The first is a spectrum display and classification tool. This
tool enables you to display a spectrum of a star and compare it with the spectra of standard stars of known spectral types.
The tool makes it easy to measure the wavelengths and intensities of spectral lines and provides a list of the wavelengths
of known spectral lines to help you identify spectral features and to associate them with particular chemical elements.
The second part of the computer program is a realistic simulation of an astronomical spectrometer attached to one of
three research telescopes—one small, one medium-sized, and one large. You will pick a telescope that is most appropri-
ate to your needs. A TV camera is attached to the telescope so you may see the star fields it is pointing to, and you can
view the fields at high and low magnification. You can steer the telescope so that light from a star will pass into the slit of
the spectrometer and then turn on the spectrometer and begin to collect photons. The spectrometer display will show the
spectrum of the source as it builds up while you collect additional photons. The spectrum is a record of the intensity of
the light collected versus the wavelength. When a sufficient number of photons are collected, you should be able to see
the distinct spectral lines that will enable you to classify the spectrum.
You can use the telescope to obtain spectra for a list of stars designated by your instructor. You will then classify your
spectra by comparing them with the spectra of standard stars stored in the computer, just as you did in the first part of the
exercise.
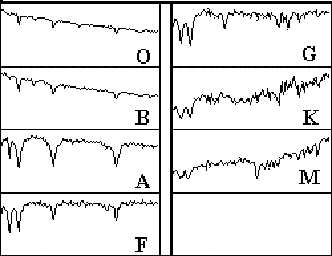
Figure 1
Digital Spectra of the Principal MK Types